
Income says nothing about what you keep. A savings balance ignores what you owe. Almost every personal finance figure can be dressed up by presentation, except one: net worth is everything you own minus everything you owe, and it moves only when your position genuinely changes.
The net worth tracker exists to record that number every month and show you its direction.
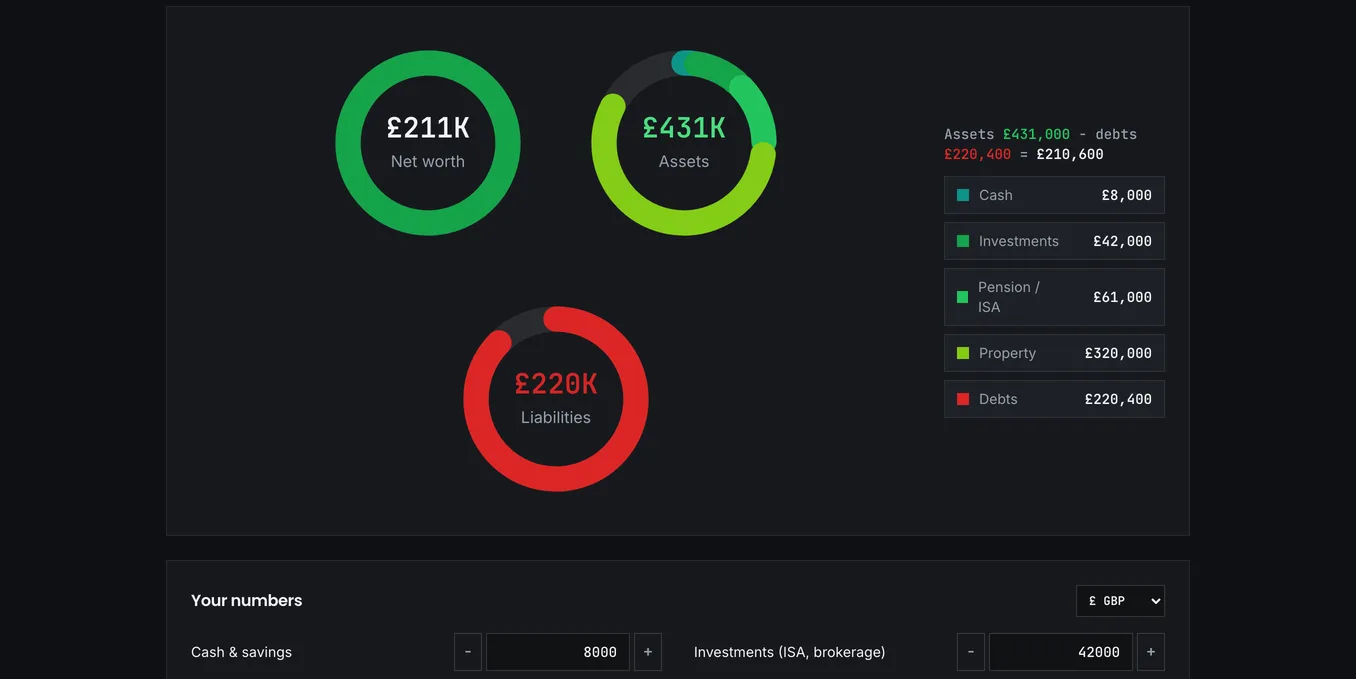
What counts, and what to leave out
Assets are anything you could convert to money: current accounts, savings, cash ISAs, stocks and shares ISAs, general investment accounts, pensions, premium bonds, crypto, the market value of your home, the trade-in value of your car. Debts are everything owed: mortgage, credit cards, overdrafts, student loan, car finance, personal loans, money owed to family.
Watch for one trap while entering all this: counting the same money twice. Cash sitting inside an ISA gets entered as the ISA balance, not as both the ISA and the cash, and the mistake is easy to make when accounts are spread across several providers.
Two entries cause most of the confusion beyond that.
Your home belongs on both sides. The property's value goes in as an asset, the outstanding mortgage as a debt, and the difference is your equity, which is genuinely part of your net worth even though you cannot spend it without moving. Consistency is what matters here: a value you refresh once a year is fine, a value you nudge upward whenever you feel optimistic is not. Revaluing the house every month is the worst version of this, because it creates movement that has nothing to do with your behaviour and drowns out the changes you actually caused. Once a year is plenty.
Your pension counts, in full, at its current value. People leave it out because it feels unreachable, but excluding it produces a figure that says nothing about your actual financial position. If access age is your concern, that is a separate and legitimate question, and after checking when your pension can actually be drawn, the pension bridge calculator is where it belongs.
Cars, furniture and possessions are usually more trouble than they are worth. A car depreciates fast enough to make your net worth fall in months where everything else went right, which is discouraging and not very informative. Include a car if it is worth enough to matter, and value it at what someone would actually pay.
Fifteen minutes, the same day each month
Pick a day (the first of the month, or payday) and record every balance on that same day each time.
Consistency matters far more than precision. Check on the 1st in January and the 28th in February and you have measured a five-week gap against a four-week one, so the difference shows up as a change you did not make. Round to the nearest ten pounds and move on; the trend is the output, not the decimals. Fifteen minutes, once a month, is the entire commitment.
Two warnings about the early stretch. The first few check-ins feel pointless, because two dots make no shape, and it takes about six months before the line starts telling you anything. That is normal and worth waiting for. And do not skip the bad months. The months you least want to record are the informative ones; a chart with gaps where things went wrong is a chart that flatters you and teaches you nothing.
Reading the tiles
Net worth is the headline: assets minus debts. It can be negative, and for anyone with a student loan and a new mortgage it usually is for a while. Negative is a starting point, not a verdict.
Assets and Debts show the two sides separately, and watching them individually beats watching the total. A month where assets rose £400 and debt rose £600 looks like a small loss on the headline figure, but what it actually shows is a change in direction, and that is worth catching early.
Since last check-in is the movement from the previous month you recorded. Expect it to bounce around: markets move, bills cluster, bonuses arrive, and one bad month is noise. Markets will hand you a £3,000 month and take it back the next, which is why the 12-month direction is the signal and anything shorter is weather. Chasing the monthly change is how people talk themselves out of a plan that is working.
Next milestone is the next round number ahead of you and how far away it sits. Arbitrary, and useful anyway. Round numbers make good targets precisely because they are memorable.
The rings and trend charts underneath show composition and history. Composition deserves a look every few months: a net worth that is 90% home equity behaves very differently from one that is 90% invested, even at the same total.
Compare it against nothing, at first
Your own previous month is the only comparison that means anything early on.
Once you have a year of data, net worth by age puts your figure against national distributions, built from the sort of household wealth data the ONS publishes. Treat that as context, not a score. The spread within any age band is enormous, and someone who started with debts from studying is not behind someone who did not; they are on a different curve.
More useful is the savings rate calculator. Savings rate predicts how fast net worth grows better than income does, and unlike net worth it responds to what you did this month rather than to everything you have ever done.
There is one more number hiding in your entries. The investable part of your net worth, excluding your home and excluding the emergency fund, is the figure the FIRE calculator wants as current savings. Keep the tracker current and you never have to guess at it.
Why history is the product
The public calculator gives you a snapshot from figures you type. Nothing is saved, so it answers "where am I today" and nothing else.
With a free account, the tracker keeps your history, draws the trend, and feeds the summary tiles on your dashboard. And since the entire value of net worth is its direction over time, history is not a nice extra here. It is the product. A single reading tells you almost nothing.
Currency is per-account, and the tracker converts everything into your display currency, so holdings spread across countries still total correctly.