
Most retirement calculators run in one direction: here is what I save each month, so what will I have at the end? That framing is useful for decades, and then one day it stops being the question. The pot to income tool runs the other way, which is the direction that matters once retirement is close.
You have a pot. What does it actually pay you each year, and for how long?
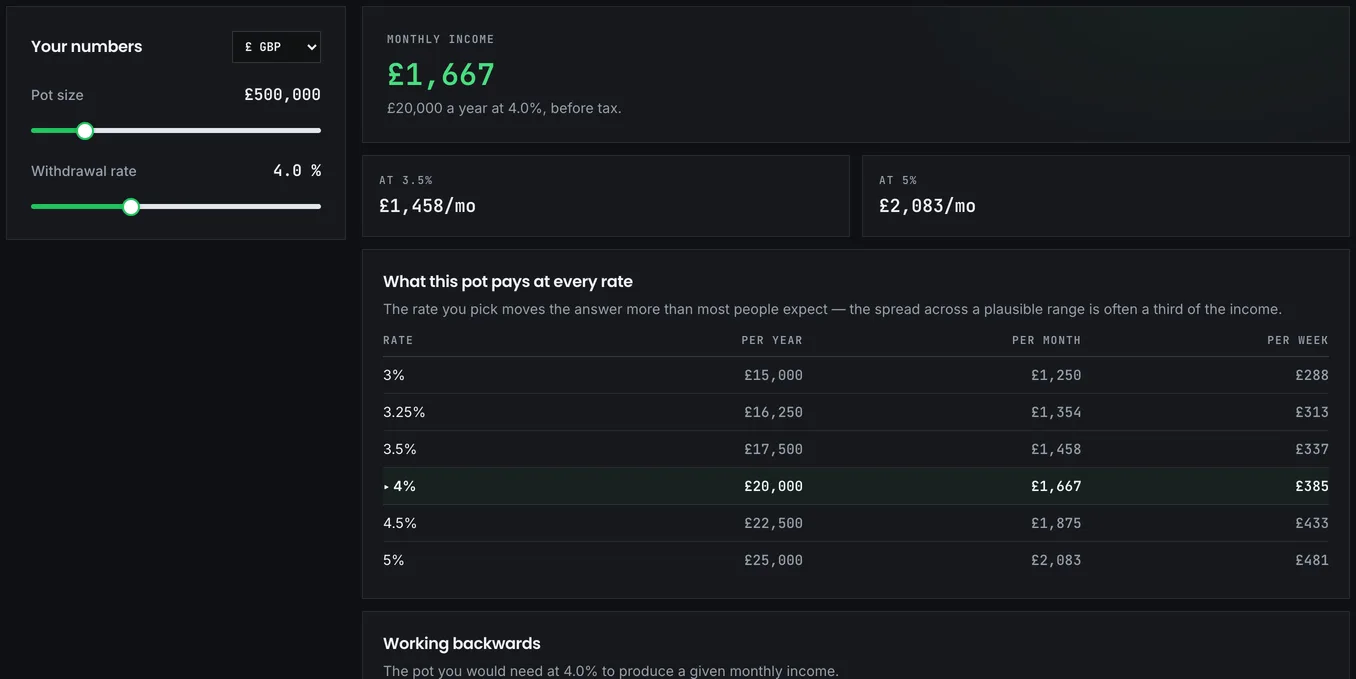
One pot, three answers
Enter the pot and a withdrawal rate and the tool hands back an annual income. £400,000 at 4% is £16,000 a year. At 3.5% it is £14,000. At 5%, £20,000, along with a materially higher chance of the money not lasting the distance.
The rate is the whole decision, really, and it hangs on how long the money must last. Twenty years is a different problem from forty. Choosing the percentage gets a full guide of its own on the safe withdrawal rate page; the short version is that longer horizons need lower rates, and anyone stopping early belongs at the cautious end.
Subtract the other incomes first
The single most common error with this tool is running it on the portfolio alone, as if the portfolio were the only thing paying for retirement.
It almost never is. Most people have a state pension arriving at some point. Plenty have an old defined-benefit scheme from a job they half remember, or rental income, or part-time earnings they intend to keep for a while. Work out your total required income, subtract everything that is not the portfolio, and apply the rate only to what remains. Someone who needs £30,000 and will receive roughly £12,000 of state pension is asking the portfolio for £18,000, which implies a very different pot from the one £30,000 does.
And the arrival dates matter as much as the amounts. If the state pension is fifteen years away, the portfolio carries the full load until then and much less afterwards. That two-phase shape is exactly what the pension bridge calculator exists to model; flattening it into one steady withdrawal for life overstates what you need.
Keep it invested, or trade it for a promise
The tool models drawdown: the money stays invested and you draw from it as you go. Drawdown keeps the pot yours, keeps it growing, and lets you take more one year and less the next. It also leaves every risk sitting on your side of the table: markets, sequence, and the possibility of living longer than you planned for.
The alternative is an annuity. Hand the pot to an insurer and you receive a guaranteed income for life, whatever markets do and however long you live. Every one of those risks transfers at a stroke. The price is steep, though. The capital is gone, there is usually nothing left to pass on, and the decision cannot be unwound once made.
Annuity rates move with interest rates and with age, and they have been considerably more attractive in recent years than during the long stretch of very low rates. If your impression of annuities was formed a decade ago, get an actual quote before relying on it. When you do, watch for two details that are frequently missed. A level annuity pays the same amount forever, which inflation erodes badly; an index-linked one starts much lower and holds its value. And enhanced rates are available for smokers and a range of health conditions, sometimes substantially better, so it is always worth disclosing everything. This is the one financial product where poor health improves the price you are offered.
Nor is the choice all-or-nothing. Annuitising enough to cover your essential spending and leaving the rest in drawdown gives you a floor you cannot outlive, plus the flexibility to enjoy whatever sits above it.
Gross is not what lands in your account
The tool reports gross income. What actually arrives depends on where the money is held.
Pensions allow 25% to be taken tax-free, subject to a cap, and the rest is taxable as income, so the personal allowance and the usual income tax rates apply. The ways a pot can legally be taken, and from what age, are set out plainly in the government's guide to personal pension rights. ISAs are tax-free entirely, on both growth and withdrawal. General investment accounts attract capital gains tax on disposals and dividend tax on income, each with its own allowance.
The practical consequence is that £20,000 drawn from an ISA and £20,000 drawn from a pension are not the same amount of money. A retiree drawing across several wrappers, or a couple using two personal allowances, keeps considerably more of the same gross figure. That is worth planning before you retire. During is too late for some of it.
The order you empty them in
Once you hold several wrappers, the sequence you empty them in changes what you keep, sometimes by a substantial amount over a long retirement. There is no single correct order, but the usual reasoning runs like this.
Use the personal allowance every year. Taking enough taxable pension income to fill it costs nothing in tax and shrinks the pot that will eventually be taxed at a higher rate; an allowance left unused does not carry forward, it simply expires. Top the rest up from ISAs, because ISA withdrawals are not taxable income, which lets you take a comfortable total while your taxable income stays low, often below the higher-rate threshold entirely. Pensions themselves are usually the thing to leave invested where you can: they have generally sat outside the estate for inheritance tax, which has made them an efficient thing to leave behind, though this is precisely the sort of rule that changes, so check the current position rather than trusting what was true a few years ago. General accounts get used deliberately, taking gains across several years to stay within the annual allowance instead of realising one large gain at once.
For a couple, running all of this across two personal allowances rather than one is the single largest saving available. The couples FIRE calculator plans the accumulation side as a pair; its projections are deliberately pre-tax, which makes this drawdown sequencing the half you have to arrange yourselves.
Before you trust the number
The figure this tool gives you is a starting point, not a verdict, so test it before building on it. See whether the rate survives a bad sequence with the Monte Carlo simulator, and whether it survives a shock at the worst possible moment with the crash test.
Then compare the income against what you actually spend rather than what you assume you spend. A figure grounded in real entries from the Expense Diary is worth far more here than an estimate, because by this stage the question has stopped being hypothetical. You are deciding whether the pot in front of you is enough.