
If you could know only one number about someone's finances, which would you pick? Most people say salary. The better answer is the percentage of their take-home pay they keep.
Savings rate predicts how long until work becomes optional almost entirely on its own, and it does so regardless of income. That second claim sounds too strong until you see why it's true, which is what this guide is for. The savings rate calculator works yours out; the sections below tell you what to feed it and what to make of the answer.
Why your salary drops out of the equation
The reason is elegant once seen. Your savings rate determines two things simultaneously: how fast the pot grows, and how large it needs to be.
Someone saving 50% is putting away one year of spending for every year worked, and their target is smaller because they live on half their income. Someone saving 10% is putting away a ninth of a year's spending per year worked, against a target built on 90% of their income. The rate sets both sides of the race at once, and income cancels out of the arithmetic entirely.
Double both people's salaries and nothing changes, provided the rate holds. That last clause is where most plans quietly fail, because a pay rise usually raises spending too, which leaves the rate flat and the timeline untouched. You got richer and no closer.
What counts as saved, and what doesn't
The calculation itself is just savings divided by take-home pay. Two decisions determine whether the answer means anything.
The first: count everything you save, including employer pension contributions and any debt repayment above the minimum. Both build net worth. Leaving out an employer match understates a great many people's rate by ten points or more, which is a big enough error to put you in entirely the wrong band.
The second: use net income, after tax, National Insurance and pension deductions, but add the pension contributions back into both the top and bottom of the fraction if you're counting them as savings. Being consistent matters more than which convention you pick, because you're mostly comparing yourself against yourself over time.
One habit to resist: don't count the capital portion of mortgage payments unless you're deliberate about it. It genuinely builds equity, but that equity is not available to live on, and counting it produces a rate that looks better than your actual progress toward being able to stop working.
From fifty years down to ten
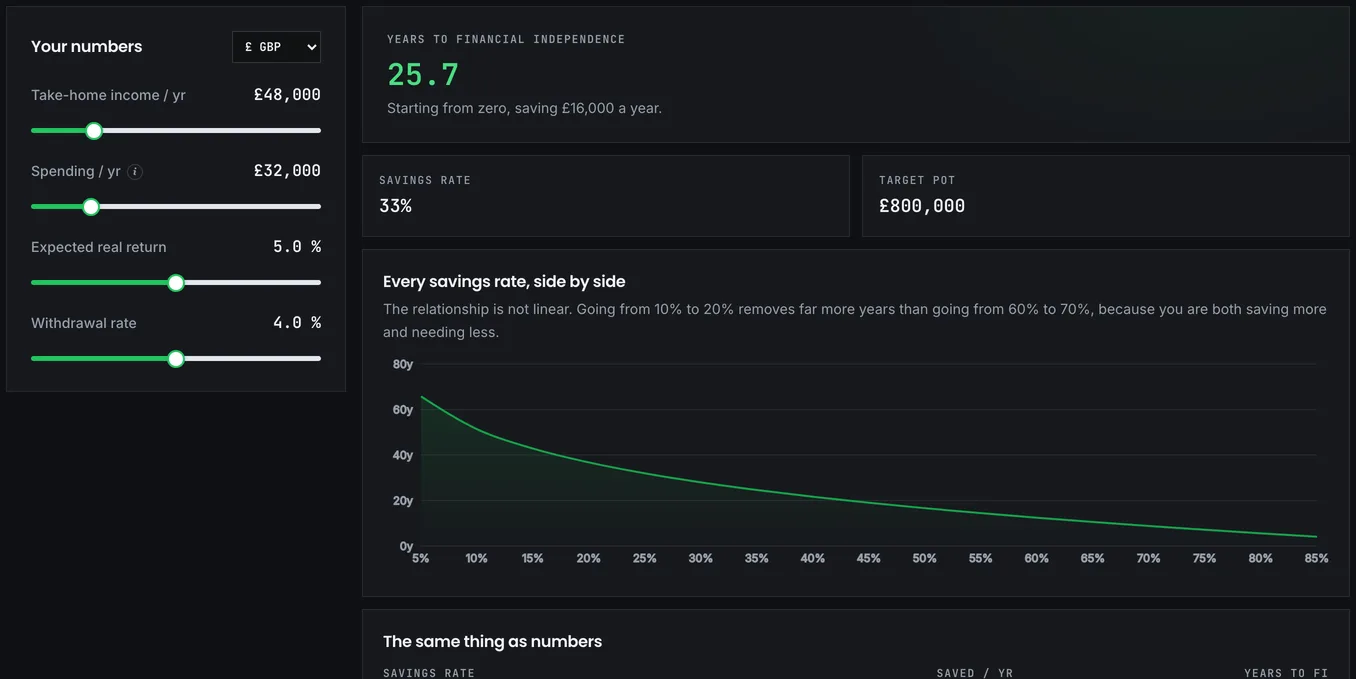
Roughly, at typical real returns and drawing 4%, a 10% rate means around 50 years to financial independence. That's the traditional pension default, and it assumes a full career. Lift the rate to 20% and the wait drops to about 37 years. At 30% it's about 28 years, at 40% around 22, at 50% approximately 17, and at 65% a little over 10.
Read that sequence again and notice it isn't linear. Going from 10% to 20% saves you about fifteen years, a larger return on effort than almost anything else available to you. Going from 50% to 60% saves about four. The same ten-point improvement, wildly different value.
It happens because a savings rate does two jobs at once. Raising it increases what you put away and reduces what you live on, which shrinks the target. At low rates both effects are large in relative terms: moving from 10% to 20% doubles your contributions while trimming your target by a ninth. At high rates the contribution side is already doing most of the work, and each further point moves it proportionally less; going from 60% to 70% raises contributions by a sixth, where the earlier jump doubled them.
The practical consequence is genuinely encouraging. The people with the most to gain from a modest improvement are the ones saving least, and the effort required to go from 8% to 18% is far smaller than the effort to go from 45% to 55%, while the reward is several times larger. Nobody needs to reach 50%. Going from 8% to 18% is transformative on its own, and it's achievable for far more people than the extreme numbers that dominate FIRE discussion.
Two levers, one of them double-acting
Only two levers exist: earn more, or spend less. Both work. They are not equally powerful per pound.
Spending reductions are permanent and compound twice. Cutting £300 a month of ongoing spending adds £3,600 a year to savings and removes £90,000 from your target at a 4% rate, because you've shrunk the life the pot has to fund. That double effect is why the FIRE sensitivity tool ranks spending above every lever you control.
Income increases only help if the rate holds. A £6,000 raise that entirely becomes spending changes nothing at all. The same raise saved in full can move your rate several points in one step, and the moment it lands is the single easiest time to improve it, because the money was never in your routine to begin with.
As for where to aim the effort: the three lines large enough to matter are housing, transport and any high-interest debt. Everything else is worth doing and will not change the band you're in.
Keeping the number honest
The rate is only useful if it's real, which means knowing what you actually spend rather than what you think you spend. Estimates run about a third low. Consistently, for everyone, including people who are sure theirs don't.
A few months of entries in the Expense Diary gives you a grounded figure, and its reports show the categories worth attacking. The 50/30/20 budget planner frames the same information as a target split if you prefer that view. Then check the rate every few months rather than obsessively. It moves slowly, and its main job in the long run is catching lifestyle creep, the gradual drift where income rises, spending follows, and the rate silently returns to where it started.
The three things it can't see
For all its predictive power, the rate says nothing about what you already have. Someone at 25% with a large pot is much closer than someone at 25% starting from nothing, and the rate alone can't distinguish them.
It assumes the rate persists, which across decades of career changes, children and moving house is a substantial assumption, and probably the biggest one in the whole framework.
And it says nothing about whether the life producing the rate is one you want. A 70% rate sustained through years of misery is not obviously a better outcome than 35% and a life you enjoy along the way. The calculator will not tell you that; someone probably should.
For the full picture, take your rate and your current pot to the FIRE calculator, which turns both into an actual age rather than a number of years from an unspecified start.