
Take whatever actually landed in your account last payday. Half of it covers needs, three tenths covers wants, and a fifth goes to savings and debt repayment. That is the entire 50/30/20 rule, and its popularity comes down to one thing: it is the only budgeting framework most people can recall without looking it up.
The budget planner applies it to your actual income and tells you where you sit against it.
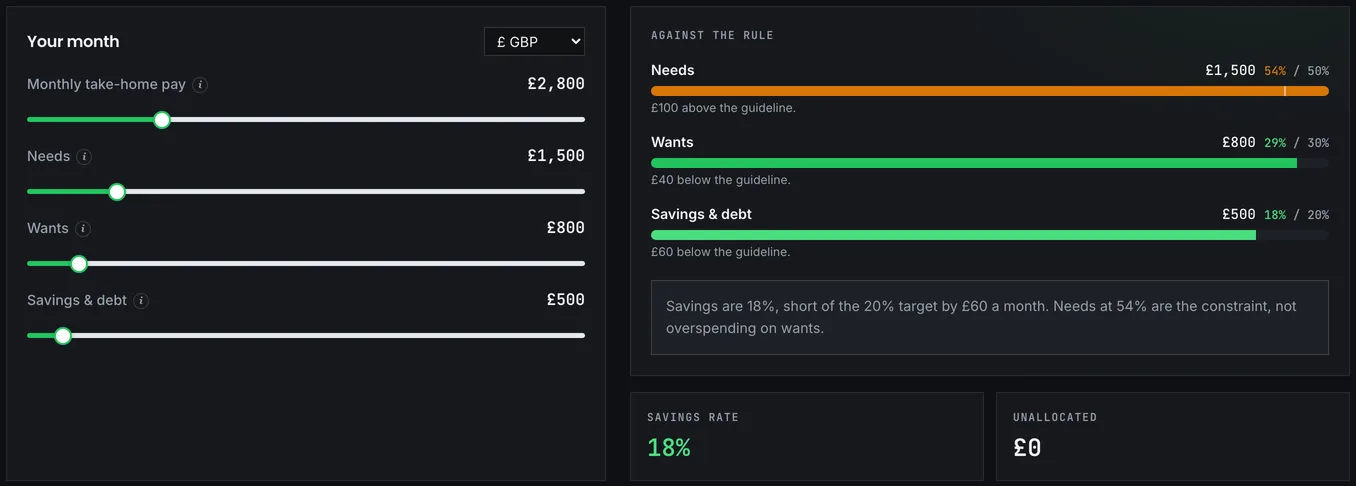
The income figure
Net, not gross. What lands in your account after income tax, National Insurance and pension contributions.
If your pay varies (commission, shift work, freelance), use a conservative month rather than an average one. A budget built on a good month fails in a normal one, and a framework that only works in your best months isn't doing anything for you.
Pension contributions sit outside this deliberately. They're already deducted before your pay arrives, and the 20% saving share is meant to be what you direct yourself.
Needs, wants, and the lines between them
Needs are what continues whether or not you want it to: rent or mortgage, council tax, utilities, groceries, insurance, essential transport, minimum debt payments, childcare. Wants are everything discretionary, from eating out and subscriptions to holidays, hobbies, and the nicer version of something you could buy cheaper. Savings covers building an emergency fund, investing, and any debt payment above the minimum.
Three categories reliably cause arguments, and it's worth settling them before you start typing. Groceries are a need, mostly; the weekly shop that includes wine, snacks and a ready meal is partly a want. Don't agonise. Put the whole thing in needs, accept a slightly generous figure, and remember the framework is a compass, not an audit. Your phone is a need too, but the £55 contract when a £12 one would do is £43 of want. And a car depends entirely on where you live: essential for a rural commute, largely discretionary in a city with transport, and often the largest single line after housing, so be honest with yourself on this one.
For everything else, a simple tiebreak. If a category takes ten seconds to place, put it in the bucket that makes you slightly uncomfortable. The version of the budget that flatters you is the one that stops being useful.
Reading the gap
Enter your figures and the planner reports your actual split against 50/30/20, in both percentages and money. Almost nobody lands on it exactly, and that's fine. The value is in the direction and size of the gap.
Needs above 50% is the most common result by a wide margin, and it is usually housing. This isn't a discipline problem, and no amount of budgeting fixes it: the only real levers are cheaper housing, a housemate, or more income. If your needs run at 65%, the honest read is that 50/30/20 does not describe your situation, and forcing your savings to 20% will come out of food.
Wants above 30% is the gap that actually responds to attention, because it's made of many small recurring decisions rather than one large fixed one. Start with the subscription audit; the annual total of things people have forgotten they pay for is routinely in the hundreds.
Savings below 20% needs a different mindset entirely, because savings is the output, not the input. It is what remains after the other two, so it improves only when one of them moves. And if you find yourself above 20%, the framework has quietly stopped being the right tool. Once you're saving 30% or 40%, the interesting question is where the money goes and how long until it's enough, which is the territory of the savings rate calculator and the FIRE calculator.
Real figures, not remembered ones
Estimating your own spending from memory produces a number roughly a third below reality. Everyone does it. It isn't a character flaw.
If you've been logging entries in the Expense Diary, take a full recent month from the reports and read the category totals straight off. Ten minutes of real data beats an hour of careful guessing, and it will change your answer.
Failing that, use three months of bank statements and take the average. One month is not enough: annual insurance, car servicing and Christmas all hide in the months you didn't look at.
When the ratio refuses to fit
For a large number of people the numbers simply refuse. Housing takes 45% on its own, needs reach 70%, and there is nothing left to reach 20% savings.
The framework hasn't failed and neither have you. 50/30/20 was written in a different housing market, and pretending otherwise helps nobody. What helps is saving something at any percentage, because a consistent 4% is worth far more than an aspirational 20% you abandon in March; the habit is what compounds, and the rate can rise later. It also helps to aim the effort where the money actually is. When needs dominate, every other adjustment is noise: housing, transport and any high-interest debt are where the movement is, and the debt payoff calculator shows what clearing the last of those frees up each month. And if your real life settles at a different split, change the ratio deliberately. A 60/25/15 that reflects your actual situation beats a 50/30/20 that describes someone else's. Write it down and treat that as your target.
Budgeting against your worst month
The framework assumes a steady monthly figure, which rules out a large number of self-employed, freelance and commission-paid people as written. It still works with one adjustment.
Budget against your floor, not your average. Take the lowest month from the past year and treat that as your income. Needs and wants are set from that figure, which means they're covered even in your worst month.
Everything above the floor then goes to savings, without being redistributed. In practice this produces a saving rate far above 20% in good months and exactly 20% in bad ones, which is the right shape for variable income. The good months are what fund the lean ones, and spending them as they arrive is how people with high average earnings end up with nothing behind them.
Keep the tax set aside separately and never count it as income. It isn't yours. It's simply not collected yet.
Come back after the pay rise
Signed in, the planner saves to your dashboard as a plan, so you can revisit it as income and costs change. It's worth redoing after any pay rise: the gap between "I got a raise" and "my savings went up" is where lifestyle creep lives, and seeing the split shift is the fastest way to notice it happening.