
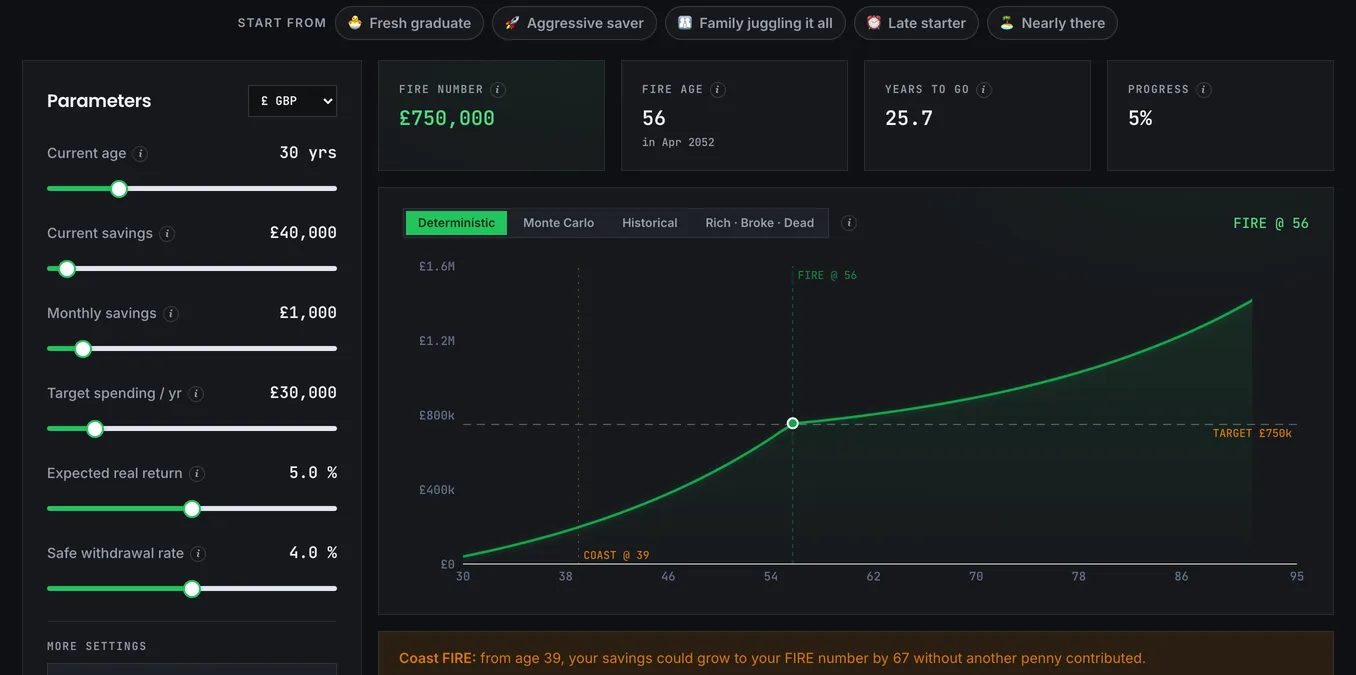
You bring three facts to this page: what you have, what you add each month, and what you expect to spend once you stop working. The FIRE calculator turns them into the one number you actually came for, the age at which work becomes optional.
Everything else on the page exists to stress-test that single number, and most of this guide is about doing exactly that.
Start with the five that move the answer
You can ignore most of the controls on a first pass. Five inputs move the answer more than all the others combined:
- Current age. The start of the projection.
- Current savings. Everything already invested for retirement: ISAs, pensions, general investment accounts, cash you genuinely will not spend.
- Monthly contribution. What actually leaves your account for investments each month, including employer pension contributions.
- Annual spending in retirement. What you want to live on each year, in today's money.
- Expected return. The real, after-inflation growth rate you assume.
Set those five and the headline figures fill in immediately. The rest of the panel is refinement.
Getting your own numbers right
Current savings trips people up most. The temptation is to include the house, the car, and the emergency fund. Don't. This figure should be money that is invested and that you are willing to draw down, and your home is not part of it unless you plan to sell and rent. If you're not sure what the total is, the net worth tracker separates investable assets from everything else, and the number it labels as investments is the one to bring here.
Monthly contribution should be the whole picture, not just what you notice leaving your current account. If you salary-sacrifice into a pension and your employer matches it, both halves count. Someone contributing 5% with a 5% employer match on a £45,000 salary is investing £375 a month before they add anything else themselves, and leaving out the employer's half understates the plan by years.
Annual spending is the input worth the most care, because the target pot is a direct multiple of it: guess high by £5,000 a year and you've added £125,000 to the pot you need at a 4% withdrawal rate. If you've been tracking with the Expense Diary, take your actual yearly outgoings and subtract what will genuinely stop. Commuting, the mortgage if it will be paid off, pension contributions themselves. What remains is a far better starting figure than an estimate made in your head.
Expected return is a real return, after inflation has been taken out, and that distinction matters more than the number itself. A globally diversified equity portfolio has historically returned somewhere near 5% real over long periods, lower once fees are paid; NYU Stern's historical returns dataset carries the year-by-year US record going back nearly a century if you want to see the raw material behind estimates like that. Enter 8% because that's the nominal figure you've seen quoted and the projection will quietly bring your retirement forward by the better part of a decade, for no reason other than a units mismatch.
Four numbers come back
The FIRE number is the pot you're aiming at: your annual spending divided by your withdrawal rate, so 25 times your spending at 4%. Nothing more sophisticated is happening there.
The FIRE age is when the projection says the pot crosses that target. It's the number everyone screenshots, and it's the least reliable one on the page, because it compounds every assumption above it. Years to go restates the same result as a distance rather than a date, and people find it easier to sanity-check; "eleven years" tends to prompt a reaction that "age 48" does not. Progress shows how far along the pot is today, and early on it moves painfully slowly. That's arithmetic, not failure: in the first years almost all the growth comes from your contributions rather than from returns.
Whatever the four say, remember what a projection is. Not a prediction, just the consequence of the assumptions you typed. Change the return by one percentage point and watch how far the date moves. That sensitivity is the real output.
Break it before you believe it
Once the headline looks plausible, the interesting work starts.
Run the crash test first. It applies a market fall at the worst possible moment, right as you stop earning, and tells you whether the plan survives. A plan that works only if markets behave is not a plan.
Then check the Monte Carlo simulation. Instead of one smooth average return, it runs your inputs across many random sequences and reports how often the money lasts. A plan that succeeds 95% of the time and one that succeeds 70% of the time can produce an identical FIRE age here, which should worry you more than any single number does.
And vary one input at a time with FIRE sensitivity, which shows which assumption your date actually hangs on. At typical inputs the tallest bar is the return assumption, which nobody controls; spending is the largest lever you do.
The errors that flatter you
Every mistake worth warning about here has the same shape: it makes the answer look better than your situation is.
Nominal returns in a real-terms field is comfortably the most common, covered above; if your number came from a headline about average stock market returns, it's probably nominal. Forgetting fees is next. A 0.9% platform-and-fund charge against a 5% real return is not a small trim, it's nearly a fifth of your growth, and the fee impact calculator puts a figure on that over a full investing lifetime. The figure is usually shocking.
Setting retirement spending to today's spending is sometimes right and often not. Mortgages end, children become independent, commuting stops, but health costs rise and free time is expensive to fill. And then there's the one UK-specific trap: ignoring when the money is reachable. A plan that hits its number at 52 with most of the pot inside a pension is not a plan to retire at 52, because UK pensions cannot normally be accessed until 57 from 2028 (the government's own paper on the rise sets out the change). The pension bridge calculator works out whether your accessible savings can carry you across that gap.
Keeping the scenario
Signed in, Save this plan puts the projection on your dashboard, where it sits alongside your other plans and updates as you revise it. You can keep several; a base case and a pessimistic one is a common and sensible pairing. If you'd rather not create an account yet, the calculator works fully without one. Nothing is stored, so bookmark the page and re-enter your figures next time, or use the share link to keep a copy of the exact scenario.
A hypothesis, not a promise
The tool doesn't know your tax position, and drawing £40,000 a year from an ISA and from a pension are not the same thing after tax. It assumes a constant real return, which no real portfolio delivers. It has no view on whether your spending estimate is realistic. And it cannot tell you whether you'll want to stop working at all; a surprising number of people reach their number and carry on, having discovered that the security was the point rather than the leaving.
Treat the date it produces as a hypothesis to test, not a promise to plan around.