
No portfolio has ever grown smoothly at 5% a year, every year, forever. Not one.
Yet that is exactly what every projection built on an average return quietly assumes, and it is a comforting lie. Returns arrive in a jagged order, and the order matters enormously once you start withdrawing. The Monte Carlo simulator exists to show you what the average hides.
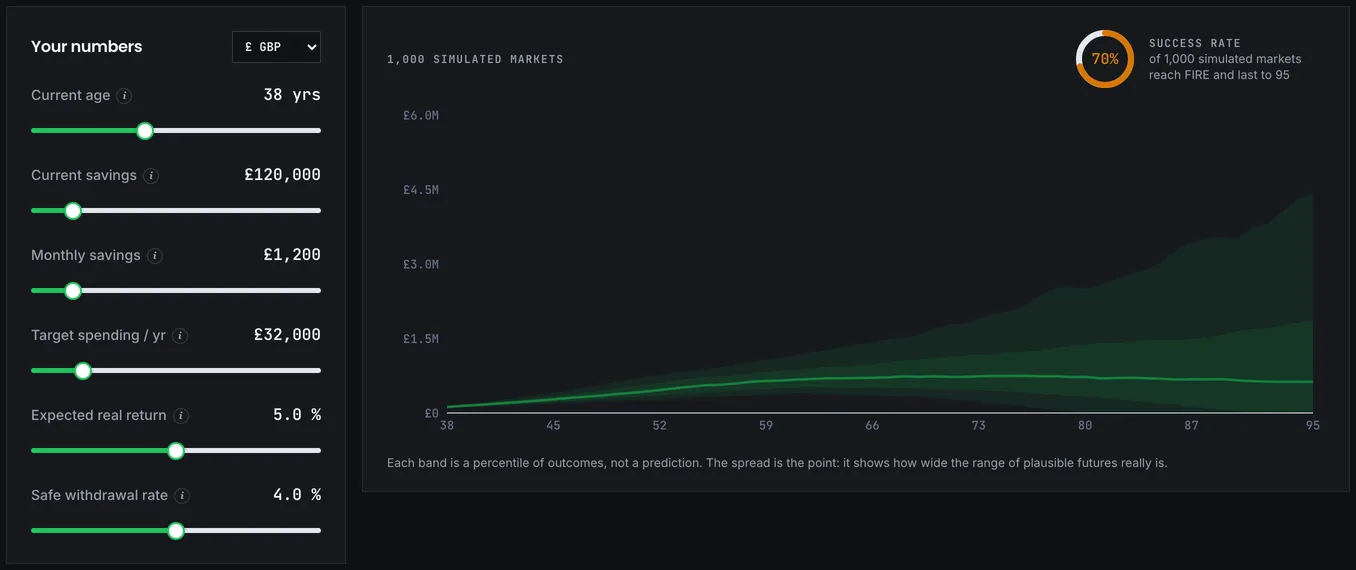
A thousand retirements, counted
The simulator runs your plan a thousand times. Each run uses a different random sequence of returns, drawn from a distribution built around the expected return you set. Then it counts: in how many of those runs did the money outlast you?
That count, expressed as a percentage, is the success rate. It is the headline output, and it is a very different kind of answer from a single projected balance.
Worth knowing what the randomness is, and isn't, before you trust it. The simulation samples from a statistical distribution, which assumes returns behave in a particular way. Real markets have fatter tails than the model, crashes sharper than any rally, and periods where everything falls together. If you want actual history instead of invented sequences, the retirement backtest runs your plan through the real ones from past decades.
Why sequence risk deserves its own name
Two retirees can experience the identical average return over thirty years and end in completely different places.
The first meets a poor decade at the start. They are selling units to live on while prices are down, permanently removing shares that would have recovered, and the pot never gets back to where it should be. The second meets the same poor decade at the end, by which point the pot has grown for twenty years and the fall lands on a much larger base that no longer needs to last as long.
Same average, opposite outcomes. This is sequence of returns risk, and averaging it away is the single biggest flaw in conventional retirement maths. It is why a plan can look comfortable in the FIRE calculator and uncomfortable here.
Setting the inputs
The sliders are the same six the FIRE calculator uses: age, current savings, monthly savings, target spending, expected return and withdrawal rate. Each run keeps contributing until the pot reaches the FIRE number your spending and withdrawal rate imply, then switches to withdrawing, and is scored on whether the money lasts to 95. Expected return should be real, after inflation and after fees, as everywhere else on the site.
Volatility, the standard deviation of annual returns, is fixed at 15% rather than offered as a slider, in line with the 15–18% a globally diversified equity portfolio has historically run. Worth knowing what that choice means: volatility describes how violently the sequence swings, so a portfolio with a substantial bond allocation swings less than the model assumes, and the answer on screen is an equity-shaped one. The model also holds it constant, which reality does not: calm years follow calm years, and crises arrive with company.
The thousand runs are seeded, so the same inputs always produce the same answer. Any flicker you notice between attempts is an input changing, not the dice.
What the success rate is really telling you
Read the success rate as an odds statement about this specific set of assumptions, not as a probability about your life. A 90% success rate means one run in ten ran out of money. That is not a pass mark. It is a statement that you are accepting a one-in-ten chance of a specific, quite serious outcome.
The path chart shows the spread. Pay attention to how wide the band gets rather than to where the middle line sits; the width is the honest picture of what you are taking on, and the lowest paths are the scenarios worth planning for. The median ending balance is where the middle run finished, which is useful and less important than the failures. And remember the model has no view on tax: withdrawals here are gross figures, and anything drawn from a pension beyond the tax-free portion is taxed as income.
So what should the number be? Below 75% is generally too fragile to build a life around, unless you have substantial flexibility elsewhere: a paid-off house, a partner still earning, a pension not yet in payment. Most reasonable plans land in the 85–95% band, and that is a sensible target; the authors of the original portfolio success rate research devoted a whole paper to exactly where that line should be drawn. Above 98% usually means you are over-saving. Reaching near-certainty requires such a large margin that you will likely work years longer than necessary and die with a great deal of unspent money, which is a real cost, just a less visible one than running out.
The crucial thing the success rate hides is flexibility. Almost every failure in these simulations comes from a retiree who kept withdrawing the same inflation-adjusted amount while their portfolio collapsed. Real people do not do this. They cut back in bad years, and modest flexibility, applied early, rescues a large share of the failing runs. The withdrawal strategies tool models exactly that, and the difference it makes to these numbers is substantial.
When the answer comes back 48%
Suppose you are 60 with £600,000, nothing more going in, spending £30,000 a year at a 5% withdrawal rate. The gauge reads 48%. The instinct is to change the return assumption until the number improves. Resist it. That changes the answer without changing the plan.
Four things genuinely move the success rate, and they are not equally priced. Flexibility is the cheapest by a wide margin: a guardrails rule that trims spending by a tenth whenever withdrawals drift well above the starting rate lifts this exact plan from 48% to 99% in the same engine, and costs nothing in the good years. A shorter horizon helps more than people expect, because thirty years is a materially easier problem than forty: the same pot and spending pass 57% of runs from age 65 and only 43% from 55, and in real life a later start does double duty, since the pot would also have kept growing. A lower withdrawal is the direct lever, and an honest but modest one at this depth of trouble; cutting spending to £28,000 buys about five points, and a full 10% cut to £27,000 reaches 57%. And a larger pot is the obvious answer and usually the slowest.
Where this fits in your sequence of tools
Run the FIRE calculator first to get a plan, then bring it here to find out how much punishment it can take. If the success rate disappoints, the four levers above are the whole menu: save more, spend less in retirement, work slightly longer, or build in flexibility, and the last is usually the cheapest and the most effective.
Then run the crash test, which asks the narrower and more visceral question: what if the market falls hard in the specific year you stop working?