
Somebody retired in 1937. Somebody else in 1938, and again in 1939, and so on through every starting year the data covers. A backtest takes your plan and asks how each of those people would have got on with it.
It invents nothing, which is the difference. A simulation draws market returns from a statistical distribution; the retirement backtest is the least theoretical tool on this site, because every path it draws actually happened to somebody.
A cohort for every start year
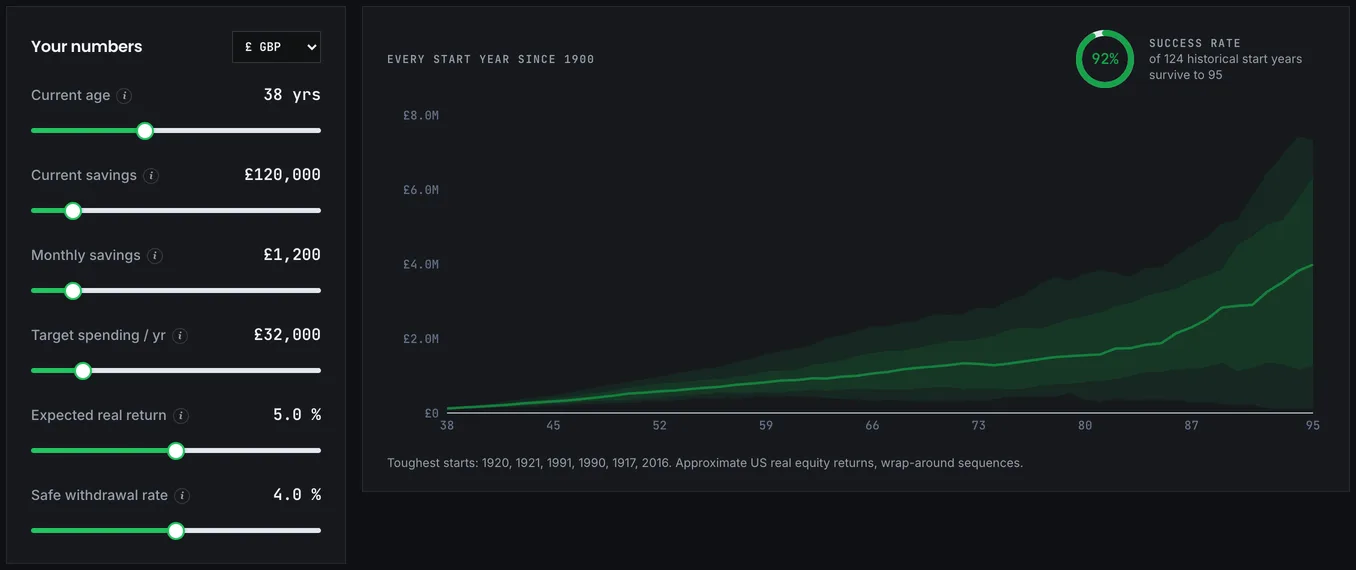
Each cohort is one start year. A retiree beginning in 1972 gets the returns of 1972, then 1973, then 1974, in that exact order, with your plan applied year by year: contributions while the pot is still short of its target, withdrawals after. This preserves something a random simulation destroys: the fact that bad years arrive in clusters, that inflation and market falls tend to show up together, and that recoveries take the shape they took rather than a statistically tidy one.
The inputs are the same six sliders as the FIRE calculator, and the tool runs every start year since 1900, more than a hundred and twenty cohorts, each to age 95. What comes back is a gauge counting the cohorts that survived, a fan of percentile bands across all of them, and a list of the toughest start years, the ones that broke the plan.
The spread is the point. You will see an enormous range of outcomes from identical plans that differed only in start date: some cohorts finish with many times what they began with, a few run out, and that range, much wider than most people expect, is the honest answer to "what will happen". Count the failures, then look at them individually. A 6% failure rate is one number; knowing that the failures all began between 1966 and 1969 tells you something far more useful about what kind of conditions break your plan. And note where the median finishes. In most historical cohorts a 4% withdrawal ends with more money than it started with. Substantially more. That is the flip side of planning for the worst case, and worth seeing, because backtests reward the cohorts that got lucky and punish the ones that did not, and the useful information is concentrated entirely in the handful that struggled.
Why 1966 beats 1929 for damage
Ask people to name the worst time to have retired and they say 1929. The crash was more dramatic, but the recovery came, and a 1929 retiree with a diversified portfolio generally survived.
The genuinely brutal cohort is 1966. There was no single spectacular crash. Instead, markets went sideways in real terms for around fifteen years while inflation ran hot, at times into double digits; put a few pounds through the Bank of England's inflation calculator across the 1970s if you want to feel what that pace does to money. A retiree taking an inflation-adjusted income watched their withdrawal climb sharply every year while the portfolio failed to grow. Nothing dramatic happened on any single day. The plan simply bled out.
That is the pattern to watch for in the fan, and it is why sustained inflation combined with flat markets is the scenario retirement plans should be tested against, rather than a sudden crash, which is the narrower question the crash test asks.
A century that contains three retirements
The past is one sample. History gives this tool 124 usable years, which contain only about four genuinely independent 30-year retirements, and that is a very small number of trials to draw confident conclusions from. Worse, the cohorts overlap heavily: a 1965 retirement and a 1966 retirement share 29 of their 30 years, so they are not two independent tests of anything.
There is survivorship in the data itself, too. The markets with long, clean, reassuring histories are the ones that did not get closed by war or revolution, and building a plan on the record of the most successful markets of the twentieth century embeds an assumption that the next century resembles it.
None of this makes the backtest useless. It makes it one of two views worth holding at once: the Monte Carlo simulator generates far more sequences but invents them, while this one uses real sequences but has very few. Where the two agree, you can be reasonably confident. Where they disagree, you have found something worth understanding.
An equity answer, on purpose
The data behind the fan is an approximation of US real equity returns, and there is no allocation dial: every cohort rides a fully invested equity portfolio. The answer this tool gives is an equity-shaped one, which is worth knowing before you lean on it.
It is not a bad shape for a long retirement. The instinct approaching retirement is to hold more bonds, which is correct over short horizons and often wrong over thirty or forty years: a portfolio held mostly in bonds produces smaller drops and much weaker growth, and the withdrawals eventually outrun what it earns. Long-retirement research, the Trinity work included, points toward somewhere between 60% and 80% equity as the range that survives most often, with cautious allocations failing slowly and undramatically rather than sharply. A heavier bond weighting would soften this tool's worst years and fail more of its longest retirements, a trade-off the tool cannot draw for you, so carry it as a caveat rather than a dial. The real reason to hold bonds is not that they improve the odds. It is that they make the ride tolerable enough that you stay invested, which is worth more than any allocation you abandon.
When a cohort runs dry
If some starting years exhaust the portfolio, four responses actually change the outcome, and they are worth taking in order of cost. Flexibility is usually the cheapest fix available: nearly every historical failure comes from a retiree mechanically increasing withdrawals with inflation through a long bad stretch, and a rule that pauses the increase after a fall rescues most of them, at a modest cost in good years. The withdrawal strategies tool shows how much difference this makes.
Lowering the starting rate is direct, effective and expensive, because it means a larger pot, which means working longer; check what your rate implies with the safe withdrawal rate tool. Shortening the horizon helps more than it looks, since forty-five years is a materially harder problem than thirty, and working eighteen more months both grows the pot and shortens the draw. And adding income that is not the portfolio (a state pension, a defined-benefit scheme, part-time work in the early years) does disproportionate good, because anything that reduces what the portfolio must carry during the dangerous first decade acts precisely where sequence risk does its damage.
Then take whatever plan survives back to the FIRE calculator and see what it costs you in years.