
One percentage sits underneath almost every retirement number on this site. Your target pot is your spending divided by it, so nudge it from 4% to 3.5% and the pot you need grows by a seventh: for a £30,000 lifestyle, from £750,000 to £857,000. That gap is several years of work, created by half a percentage point.
The safe withdrawal rate tool exists so that number is a decision rather than an inherited default.
Where 4% came from
In 1994 a US financial adviser, William Bengen, asked a specific question: what is the highest percentage of a portfolio someone could have withdrawn in year one, then increased with inflation every year, without running out over 30 years, using actual US market history rather than averages?
His answer, for a portfolio split roughly evenly between US stocks and bonds, was a little over 4%. The Trinity Study a few years later tested similar ground, found comparable results, and the shorthand stuck.
But the 4% rule is not a law and was never presented as one. It is one researcher's answer to one precisely specified question about one country's history, and two details from that origin get dropped almost every time it is quoted. It was built on US market history, which was exceptionally good by international standards over the twentieth century. And it assumed a 30-year horizon, chosen for someone retiring at 65.
What travels badly from 1994 America
Start with the horizon. Retiring at 45 means planning for 45 or 50 years, not 30, and the failure rate climbs as the horizon lengthens: more time to meet a bad sequence, less margin to absorb it. Anyone retiring early should treat 4% as an upper bound rather than a target.
Then the market history itself. UK equities and gilts did not replicate the US experience, and the 1970s in particular combined a severe market fall with inflation that reached levels the US never saw. Studies using UK data have generally landed on figures below 4%, often nearer 3.5%. If your portfolio and your costs are in sterling, planning at the American number is optimistic.
Fees quietly eat at it too. Bengen's figure assumed no charges at all. A 0.7% all-in cost does not reduce a 4% withdrawal to 3.3%, but it does consume a meaningful slice of the margin the rule depends on, and the fee impact calculator shows the scale of that over a full retirement.
And the research modelled a diversified portfolio. Cash and a heavy bond allocation do not support the same withdrawal, because the rule relies on equity growth to outpace the withdrawals.
The other side of worst-case
Here is what the cautious framing hides: 4% is a worst-case result, not an average one. It is the rate that survived the worst starting year in the data. In the large majority of historical periods, a retiree taking 4% died with substantially more money than they started with, often several times more.
That asymmetry deserves a moment. Plan at a rate designed to survive 1966, and if you do not happen to retire into 1966, you will very likely underspend by a wide margin for decades.
The escape from that trade-off is not a higher fixed rate. It is flexibility: a rule that adjusts what you take according to how the portfolio is doing. Rules like that routinely support a higher starting withdrawal than any fixed rate can, and they are the whole subject of the withdrawal strategies tool.
Move the rate and watch the pot
The tool works in either direction. Enter a pot and a rate to get the income it supports, or enter your desired income and a rate to get the pot required. Most people use the second, because spending is the thing you actually know.
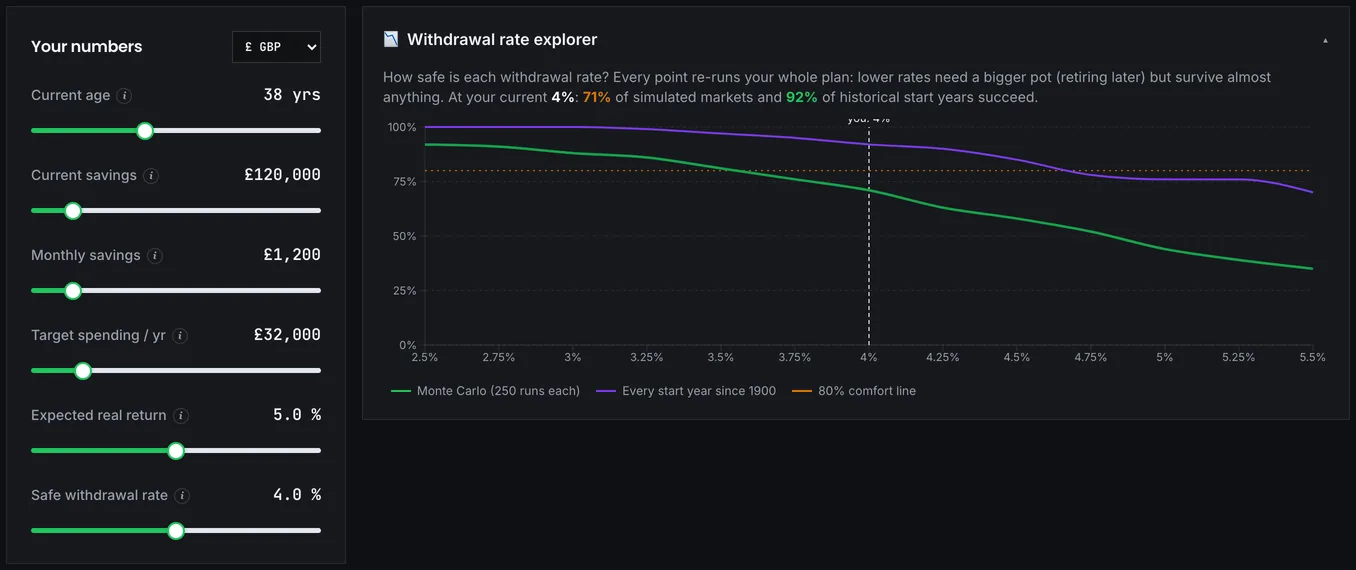
Then move the rate and watch the pot. That sensitivity is the real output. The difference between 3.5% and 4.5% on the same income is enormous, and seeing it plainly tends to change how confidently people quote the number afterwards.
The state pension changes the shape
For UK readers there is a structural detail that most American writing on this subject cannot help you with, and it materially improves early retirement arithmetic.
The state pension does not arrive when you retire. It arrives at state pension age, currently 66, rising to 67 and legislated to reach 68. For someone stopping at 50, that means the portfolio carries the entire load for around seventeen years, and then a significant chunk of spending is permanently covered by something that is inflation-linked and does not run out.
This splits your retirement into two different problems. The first stretch needs a portfolio that can support your full spending. The second needs one that covers only the gap between the state pension and your costs. Modelling that as a single flat withdrawal across forty-five years overstates what you need, sometimes considerably. A couple both receiving the full new state pension have a joint amount that covers a substantial share of a modest lifestyle, and every pound of it is a pound the portfolio never has to produce.
Landing on your own percentage
There is no correct answer, but the shape of a sensible one is clear enough, and it bends with your retirement age. Retiring at 60 or later, with a state pension arriving partway through, 4% is defensible, and the pension's arrival reduces the strain considerably. In your fifties, somewhere between 3.5% and 4% makes sense, paired with an intention to spend less in poor years. In your forties or earlier, 3% to 3.5%, and treat flexibility as essential rather than optional, because a 50-year horizon is a genuinely different problem from the one the research answered. Any of these shifts upward if other income exists (a rental, a part-time role, a defined-benefit pension), since everything that carries part of the load lets the portfolio rate sit higher.
Whatever you pick, the rate is an assumption to be tested rather than a guarantee to rely on. Run it through the Monte Carlo simulator to see how often it survives across many sequences, and through the retirement backtest to see how it would have fared starting in each real year of the past.
Then take the pot it implies to the FIRE calculator, which turns it into an age.